AIM: How to interface Bar-graph with Arduino.
[nextpage title=”Description” ]
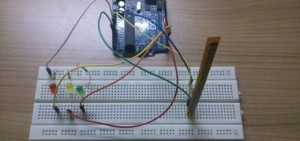
The bar graph – a series of LEDs in a line, such as you see on an audio display – is a common hardware display for analog sensors. It’s made up of a series of LEDs in a row, an analog input like a potentiometer, and a little code in between. You can buy multi-LED bar graph displays fairly cheaply, like this one. This tutorial demonstrates how to control a series of LEDs in a row, but can be applied to any series of digital outputs.
The sketch works like this:
[list type=”check”]
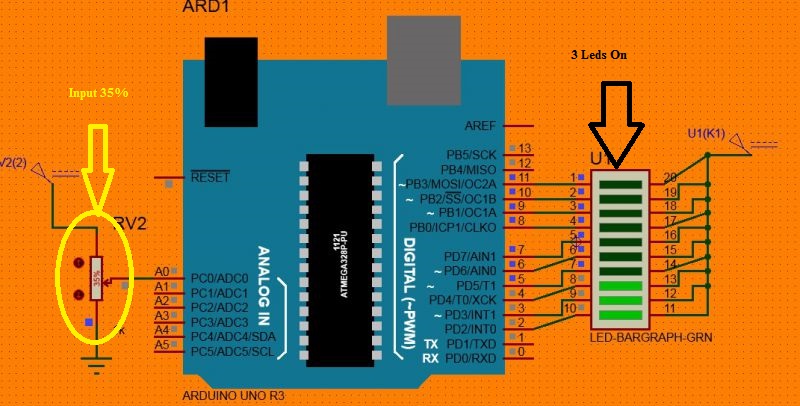
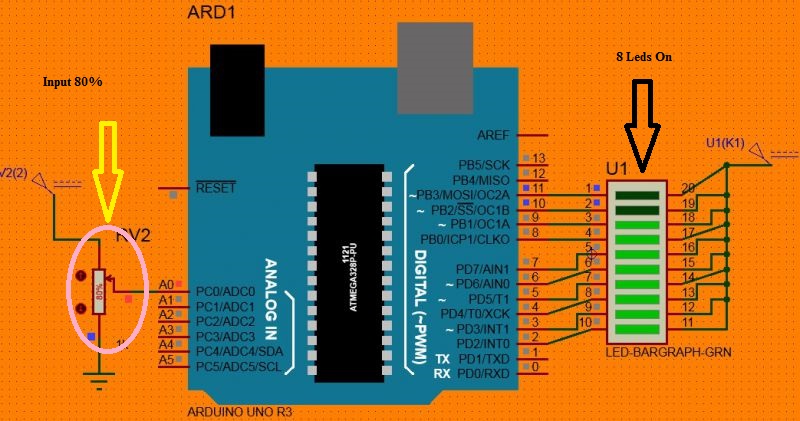
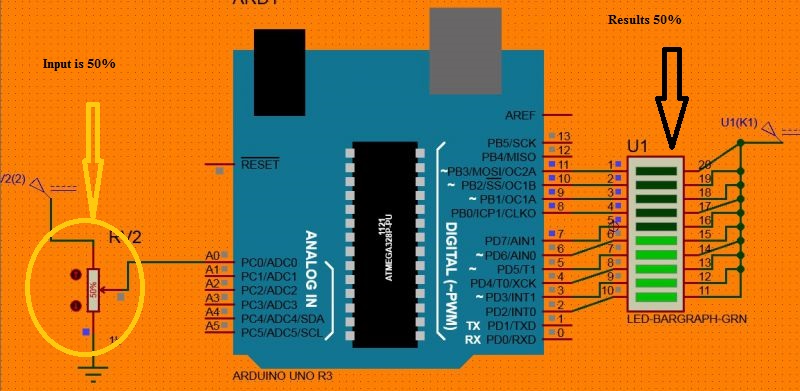
- first you read the input.
- You map the input value to the output range, in this case ten LEDs.
- Then you set up a for loop to iterate over the outputs. If the output’s number in the series is lower than the mapped input range, you turn it on.
- If not, you turn it off.
[/list]
[/nextpage]
[nextpage title=”Component” ]
Component Required
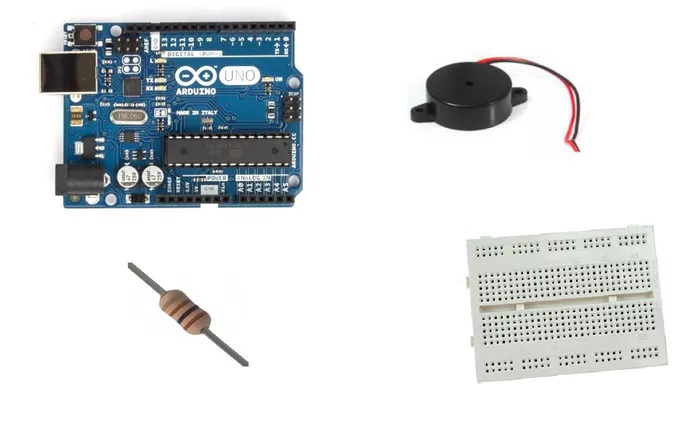
- Arduino Board
- LED bargraph display (bargraph meter)
- (1) Potentiometer
[/nextpage]
[nextpage title=”Software” ]
Software Used :
Proteus
Arduino
[/nextpage]
[nextpage title=”Circuit” ]
Circuit Diagram and Simulation Results
[visitor]
Arduino schematic is below
Click here to view Block Diagram and Code (Free Registration )
[/visitor]
[member]
Arduino schematic is below
[/member]
[/nextpage]
[nextpage title=”Code” ]
Code
[visitor]
Click here to view Block Diagram and Code (Free Registration )
[/visitor]
[member]
[message_box title=”Program” color=”yellow”]
// arduino programming language
const int input = A0; // the pin that the potentiometer is attached to
const int output = 10; // the number of LEDs in the bargraph meter
int ledP[] = {
2, 3, 4, 5, 6, 7,8,9,10,11 }; // an array of pin numbers to which LEDs are attached
void setup() {
// loop over the pin array and set them all to output:
for (int thisLed = 0; thisLed < output; thisLed++) {
pinMode(ledP[thisLed], OUTPUT);
}
}
void loop() {
// read the potentiometer:
int sensorReading = analogRead(input);
// map the result to a range from 0 to the number of LEDs:
int ledLevel = map(sensorReading, 0, 1023, 0, output);
// loop over the LED array:
for (int thisLed = 0; thisLed < output; thisLed++) {
// if the array element’s index is less than ledLevel,
// turn the pin for this element on:
if (thisLed < ledLevel) {
digitalWrite(ledP[thisLed], HIGH);
}
// turn off all pins higher than the ledLevel:
else {
digitalWrite(ledP[thisLed], LOW);
}
}
}
[/message_box] [/member]
[/nextpage]
If you like to simulate arduino in proteus than you can use below link. Follow steps given in link,

Post Comment
You must be logged in to post a comment.