In designing various parts of a machine, it is necessary to know how the material will function in service. For this, certain characteristics or properties of the material should be known. The mechanical properties mostly used in mechanical engineering practice are commonly determined from a standard tensile test. This test consists of gradually loading a standard specimen of a material and noting the corresponding values of load and elongation until the specimen fractures. The load is applied and measured by a testing machine. The stress is determined by dividing the load values by the original cross-sectional area of the specimen. The elongation is measured by determining the amounts that two reference points on the specimen are moved apart by the action of the machine. The original distance between the two reference points is known as gauge length. The strain is determined by dividing the elongation values by the gauge length.
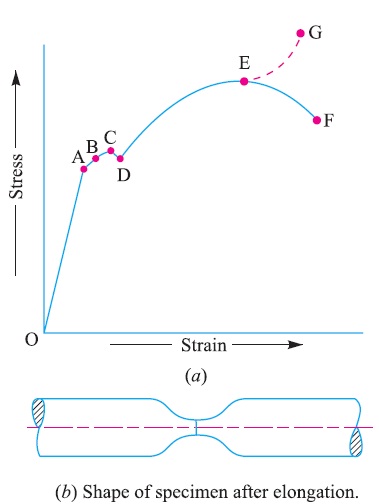
The values of the stress and corresponding strain are used to draw the stress-strain diagram of the material tested. A stress-strain diagram for a mild steel under tensile test is shown in Fig. 4.12 (a). The various properties of the material are discussed below :

1. Proportional limit: We see from the diagram that from point O to A is a straight line, which represents that the stress is proportional to strain. Beyond point A, the curve slightly deviates from the straight line. It is thus obvious, that Hooke’s law holds good up to point A and it is known as proportional limit. It is defined as that stress at which the stress-strain curve begins to deviate from the straight line.
2. Elastic limit: It may be noted that even if the load is increased beyond point A upto the point B, the material will regain its shape and size when the load is removed. This means that the material has elastic properties up to the point B. This point is known as elastic limit. It is defined as the stress developed in the material without any Permanent set.
Note: Since the above two limits are very close to each other, therefore, for all practical purposes these are taken to be equal.
3. Yield point: If the material is stressed beyond point B, the plastic stage will reach i.e. on the removal of the load, the material will not be able to recover its original size and shape. A little consideration will show that beyond point B, the strain increases at a faster rate with any increase in the stress until the point C is reached. At this point, the material yields before the load and there is an appreciable strain without any increase in stress. In case of mild steel, it will be seen that a small load drops to D, immediately after yielding commences. Hence there are two yield points C and D. The points C and D are called the upper and lower yield points respectively. The stress corresponding to yield point is known as yield point stress.
4. Ultimate stress: At D, the specimen regains some strength and higher values of stresses are required for higher strains, than those between A and D. The stress (or load) goes on increasing till the point E is reached. The gradual increase in the strain (or length) of the specimen is followed with the uniform reduction of its cross-sectional area. The work done, during stretching the specimen, is transformed largely into heat and the specimen becomes hot. At E, the stress, which attains its maximum value is known as ultimate stress. It is defined as the largest stress obtained by dividing the largest value of the load reached in a test to the original cross-sectional area of the test piece.

5. Breaking stress: After the specimen has reached the ultimate stress, a neck is formed, which decreases the cross-sectional area of the specimen, as shown in Fig. 4.1 (b). A little consideration will show that the stress (or load) necessary to break away the specimen, is less than the maximum stress. The stress is, therefore, reduced until the specimen breaks away at point F. The stress corresponding to point F is known as breaking stress.
Note : The breaking stress (i.e. stress at F which is less than at E) appears to be somewhat misleading. As the formation of a neck takes place at E which reduces the cross-sectional area, it causes the specimen suddenly to fail at F. If for each value of the strain between E and F, the tensile load is divided by the reduced crosssectional area at the narrowest part of the neck, then the true stress-strain curve will follow the dotted line EG. However, it is an established practice, to calculate strains on the basis of original cross-sectional area of the specimen.

6. Percentage reduction in area: It is the difference between the original cross-sectional area and cross-sectional area at the neck (i.e. where the fracture takes place). This difference is expressed as percentage of the original cross-sectional area.
Let, A = Original cross-sectional area, and
a = Cross-sectional area at the neck.
Then reduction in area = A – a
and percentage reduction in area = (A-a)×100/A
7. Percentage elongation: It is the percentage increase in the standard gauge length (i.e. original length) obtained by measuring the fractured specimen after bringing the broken parts together.
Let l = Gauge length or original length, and
L = Length of specimen after fracture or final length.
∴ Elongation = L – l
and percentage elongation = (L-l)×100/L
Note : The percentage elongation gives a measure of ductility of the metal under test. The amount of local extensions depends upon the material and also on the transverse dimensions of the test piece. Since the specimens are to be made from bars, strips, sheets, wires, forgings, castings, etc., therefore it is not possible to make all specimens of one standard size. Since the dimensions of the specimen influence the result, therefore some
standard means of comparison of results are necessary.
As a result of series of experiments, Barba estabilished a law that in tension, similar test pieces deform similarly and two test pieces are said to be similar if they have the same value of , l/A^0.5 where, l is the gauge length and A is the cross-sectional area. A little consideration will show that the same material will give the same percentage elongation and percentage reduction in area. It has been found experimentally by Unwin that the general extension (up to the maximum load) is proportional to the gauge length of the test piece and that the local extension (from maximum load to the breaking load) is proportional to the square root of the cross-sectional area. According to Unwin’s formula, the increase in length,
δl = b.l + C (A)^0.5
and percentage elongation = (δl/l)×100
where, l = Gauge length,
A = Cross-sectional area, and
b and C = Constants depending upon the quality of the material.
The values of b and C are determined by finding the values of δl for two test pieces of known length (l) and area (A).
Reference
A Textbook of Machine Design by R.S.Khurmi and J.K.Gupta


Post Comment
You must be logged in to post a comment.